In the game of meme coin trading, what you don’t see can hurt you most. Beyond charts and hype, there’s one hidden layer that determines who wins and who gets dumped on: token distribution.

While most traders chase memes, insiders chase control. And if you’re not watching how tokens are distributed and who’s holding them, you might be playing against a stacked deck.
This guide breaks down how to read token distribution on Solana, identify dangerous wallet patterns, and build trading strategies that protect you from silent insiders.
Why Token Distribution Matters
Token distribution defines who controls the supply, how liquid the token is, and who can crash the price in one transaction. A meme coin can look promising on the surface, but if insiders hold 70% of the supply, your position is at their mercy.
For example, a promising Solana meme coin in early 2025 pumped 20x in two hours, then instantly crashed. Why? One insider wallet dumped 45% of the supply, draining the liquidity pool.
Therefore, learning how to read token holder data isn’t optional; it’s survival.
Key Token Distribution Metrics to Detect Insider Control
Use Solana block explorers (like Solscan, SolanaFM) to analyze

Top Holder Concentration
- Top 10 wallets control over 60%? => High risk.
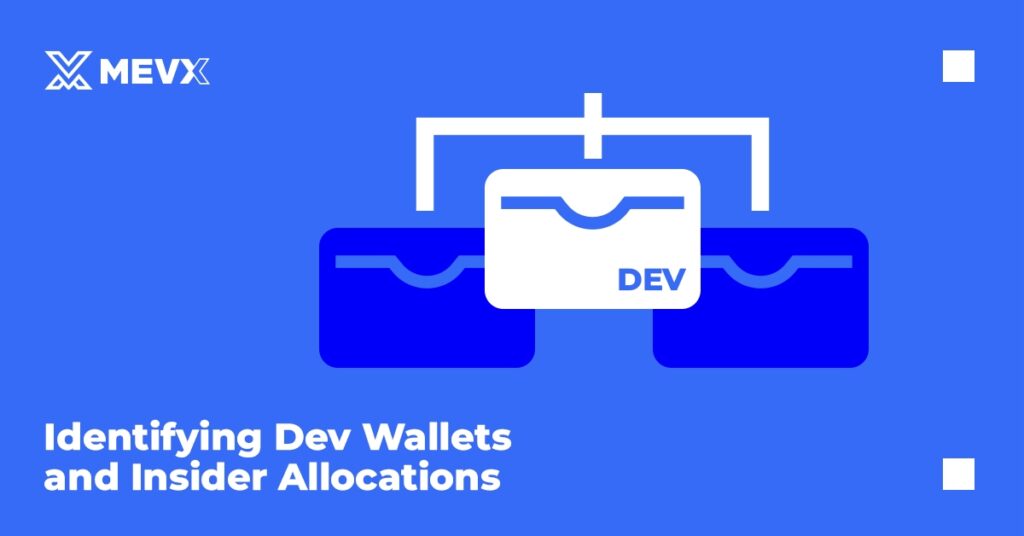
- More than 25% in a single wallet? => Likely a team or early investor wallet.
Liquidity Pool Holdings
- How many tokens are actually in the pool?
- If 90% are outside the pool, the price can be manipulated easily.
Dead or Burned Wallets
- Look for tokens sent to dead addresses.
- True burns should be verifiable and irreversible.
Airdrop vs. Insider Split
- Was the supply widely distributed?
- Or does the majority trace back to just a few wallets?
Tools for Comprehensive Token Distribution Analysis
These platforms can help you break down wallet control
- Solscan – Tracks top holders, wallet tags, and movement history
- SolanaFM – Cluster analysis and tagging for wallets
- Birdeye – Shows holder concentration + liquidity metrics
- Step Finance – Portfolio and on-chain activity viewer
- Tensor Trade (for NFT tokens) – Sometimes reveals holder overlap
For advanced users
- Use Bubble Maps on MevX or follow @Lookonchain (X/Twitter) for visual wallet graphs

Token Distribution Red Flags to Avoid
Pay close attention to suspicious patterns:
Pre-Launch Accumulation Patterns
Be wary of projects where large wallets accumulate significant positions before any public marketing or social media presence.
This often indicates insider knowledge or coordinated efforts to manipulate launch dynamics.
Unusual Staking or Lock Patterns
While token locks can indicate commitment, be suspicious of:
- Locks with early unlock mechanisms controlled by team wallets
- Staking contracts that allow preferential withdrawal terms for specific addresses
- Liquidity provision that can be withdrawn without community notice
Hidden Team Allocations
Some projects disguise team allocations through:
- “Community airdrops” that primarily go to insider-controlled wallets
- Gradual accumulation through multiple small purchases that, when aggregated, represent significant team positions
- Yield farming rewards are disproportionately allocated to team-controlled liquidity
Token Distribution Analysis in Practice
Pre-Investment Checklist
Before investing in any meme coin, complete this distribution analysis:
- Calculate the current Gini coefficient and compare it to similar successful projects
- Identify and track the top 20 holders over the past week
- Analyze purchase timing patterns for early large holders
- Verify claimed community distributions against actual on-chain data
- Set up monitoring for any concerning wallet clusters
Ongoing Monitoring Strategy
Successful meme coin trading requires continuous distribution monitoring:
- Daily top holder percentage checks
- Weekly distribution trend analysis
- Real-time alerts for large holder movements
- Correlation tracking between insider activity and price action
Integration with Trading Decisions
Use distribution insights to inform your trading strategy:
- Higher concentration = smaller position sizes and tighter stop losses
- Improving distribution trends = potential for position increases
- Insider selling patterns = prepare exit strategies
- New large holder accumulation = possible upcoming catalysts
Building Your Distribution Analysis Workflow
Start each trading day by reviewing overnight distribution changes for your watchlist. Use this data to adjust position sizes and risk parameters before market volatility increases.
Remember that token distribution analysis is most powerful when combined with other on-chain metrics like liquidity analysis and transaction patterns.
No single metric should drive trading decisions, but distribution data provides crucial context for understanding project dynamics and potential price movements.
The key to successful meme coin trading lies in identifying projects with improving distribution trends early, before the broader market recognizes the opportunity.
Master these token distribution analysis techniques, and you’ll significantly improve your ability to spot legitimate projects while avoiding insider-controlled schemes designed to extract value from retail traders.
Conclusion: Read the Holders, Read the Game
Token distribution tells you the real story behind the hype. When you understand who holds what, how much, and when they can move it, you level up from follower to strategist. Most meme coin traders chase momentum. You? You’ll chase the truth on-chain trading.
In the next article, we’ll dive into how to read contracts on Solana, so you can decode mint functions, detect backdoors, and take your meme coin mastery to the next level.
If you want to be a meme coin trading master, follow the MevX blog today!
Share on Social Media:
